Statistics Homework Help: Solve Stats Problems Step by Step
By ADMIN | Updated on: October 2026
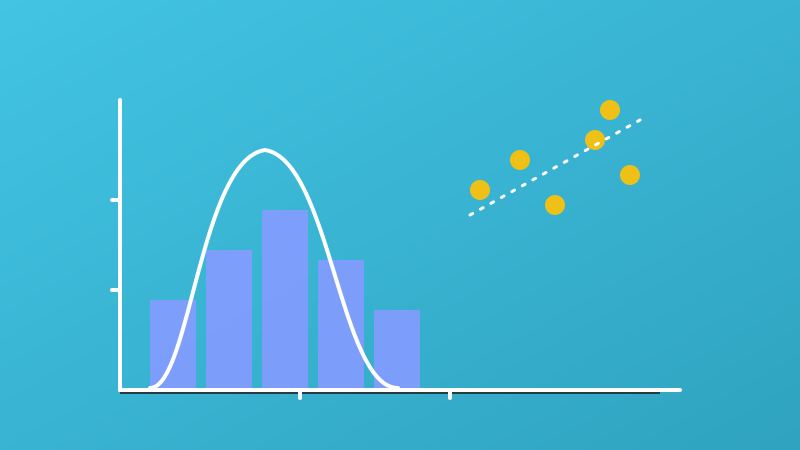
Statistics homework doesn't usually ask for one right number. It asks you to describe data, estimate how confident you are, or decide whether a result is real or just random noise. That's a different skill than solving for x, which is exactly why so many students who are fine at algebra get stuck here.
This guide covers the core topics a stats class actually tests, walks through one full problem step by step, lists the mistakes that cost the most points, and covers how to get real statistics help, not just a number copied from somewhere else.
Why Statistics Homework Feels Different From Algebra or Geometry
Algebra and geometry mostly have one correct answer. Statistics deals with uncertainty on purpose, a good stats answer often includes a number and a sentence explaining how sure you are and why. That extra sentence is where most homework points actually live, and it's easy to skip if you're used to math that ends the moment you get a number.
Research on statistics anxiety backs this up. A survey covering over 300 North American psychology programs found that 98% require at least one stats course, and students consistently rank it as their most anxiety-inducing class, driven less by the math itself and more by course pace, procrastination, and unfamiliar vocabulary.
The Core Topics Every Stats Course Covers
Course names vary, but the content is remarkably consistent. The College Board's AP Statistics framework groups the whole subject into five units, and most high school and intro college courses follow roughly the same order.
1. Describing One Variable of Data
Mean, median, mode, range, and standard deviation. This is where you learn mean is the average and gets pulled by extreme values, while median is the middle value and ignores them, which is why income data is usually reported as a median.
2. Probability, Random Variables, and Distributions
Basic probability rules, then random variables and the distributions that describe them, most importantly the normal distribution, the symmetric bell-shaped curve that a huge share of statistics problems assume your data follows.
3. Sampling and Study Design
How a sample was collected changes what you can conclude from it. A biased sample, like only surveying people who volunteer, can make a result look real when it isn't. This unit is mostly reasoning, not calculating, which is why students who are strong at formulas sometimes struggle here.
4. Inference: Confidence Intervals and Hypothesis Tests
This is the heart of most intro stats courses. A confidence interval estimates a range a true value probably falls in. A hypothesis test checks whether a result is surprising enough to conclude something real is going on, rather than random chance.
5. Regression and Correlation
Describing the relationship between two variables with a line, and being careful about the difference between correlation (two things move together) and causation (one actually causes the other). Ice cream sales and drowning rates both rise in summer; neither causes the other, heat does.
That five-unit structure is laid out in detail on the College Board's official AP Statistics course page, which is worth a look if you want to see exactly how much weight each topic gets on a real exam.
A Hypothesis Test, Worked Through
Here's a typical problem: a cereal box claims an average weight of 500 grams. A student weighs a random sample of 20 boxes and gets a sample mean of 496 grams with a standard deviation of 12 grams. Is the box underfilled, or is this just normal variation?
Step 1, state the hypotheses. The null hypothesis (H₀) is that the true average is 500 grams. The alternative (Hₐ) is that it's less than 500 grams, since that's what the student suspects.
Step 2, check conditions. The sample is random and reasonably large (n = 20), so a t-test is appropriate here rather than assuming a perfect normal distribution.
Step 3, calculate the test statistic. t = (sample mean − claimed mean) ÷ (standard deviation ÷ √n) = (496 − 500) ÷ (12 ÷ √20) ≈ −1.49.
Step 4, find the p-value and compare it to a significance level (usually 0.05). A t-value of −1.49 with 19 degrees of freedom gives a p-value around 0.076.
Since 0.076 is greater than 0.05, there isn't enough evidence to say the boxes are underfilled, even though the sample average came in a little low. "Not enough evidence to conclude X" is a real, correct answer in statistics, not a non-answer.
That last line is worth sitting with. A lot of students assume a hypothesis test has to prove something is wrong. Often the honest conclusion is that the data doesn't show enough of a difference to be sure, and writing that out clearly is usually worth real credit.
The Mistakes That Cost the Most Points
Mixing up population and sample. A population includes everyone or everything you care about; a sample is the smaller group you actually measured. Formulas and symbols change depending on which one you're working with, and grabbing the wrong formula is one of the most common stats errors.
Rounding too early. Rounding a number in the middle of a multi-step calculation, then using that rounded number in the next step, compounds small errors into a wrong final answer. Carry extra decimal places until the very last step.
Misreading a p-value. A p-value is not "the probability the null hypothesis is true." It's the probability of seeing a result this extreme if the null hypothesis were true. That distinction shows up on nearly every stats exam.
Treating correlation as causation. Finding that two variables move together is not proof that one causes the other. A third factor, or pure coincidence, can explain the link just as well.
Skipping the context sentence. Stats problems almost always want a conclusion written in plain language, tied back to the original question, not just a number. "t ≈ −1.49" isn't a finished answer; "the data doesn't give enough evidence that the boxes are underfilled" is.
How to Get Statistics Homework Help Without Just Copying an Answer
The fastest way to get stuck is trying to re-learn an entire unit at once. Name the exact skill first, confidence intervals, a specific type of hypothesis test, reading a distribution, and work on that one piece.
A free tool like the AI Statistics Solver can take your actual numbers and show every step of a calculation, mean, standard deviation, a t-test, so you can check your own work or see where your process went wrong, instead of just getting a final number with no explanation.
If the problem involves probability counting or combinations before the statistics part even starts, the AI Math Solver can untangle that setup first.
Before a test, Premium's Quiz Me can drill just the vocabulary that trips people up, type I vs. type II error, confidence level vs. confidence interval, and Practice Sets can generate fresh problems on the one topic you're shakiest on instead of ones you've already memorized.
Using any of these tools to see worked steps, then redoing the problem yourself from scratch, is a study aid. Copying a final answer straight onto your homework without understanding it is the same as copying from a classmate, and it leaves you with nothing when a similar problem shows up on a test.
Statistics Tutor vs. AI Homework Helper vs. Doing It Alone
An online statistics tutor is strongest when you're confused about a concept itself and need someone to notice that confusion and explain it a different way. That back-and-forth is harder for a tool to replicate, and tutoring sessions, in-person or online, usually cost money and need to be scheduled in advance.
An AI homework helper is available instantly and free, and it's strongest once you already have a specific problem in front of you and want to see it solved step by step. It won't notice you're confused unless you tell it, so it works best when you already know roughly what you're stuck on.
Most students end up using both: an AI tool for working through individual problems night to night, and occasional human help, a teacher's office hours, a tutor, a study group, when a whole concept still isn't clicking after a few attempts on your own.
If you're also working through geometry or chemistry this term, the same step-by-step approach works there too, see our geometry homework help guide and chemistry homework help guide for the subject-specific versions of this advice.
Frequently Asked Questions
What is the best way to get statistics homework help online?
Start by naming the exact topic, mean vs. median, a confidence interval, a specific hypothesis test, instead of searching for help with the whole chapter. A free AI statistics solver can walk through the steps on your actual problem, and a human or online tutor is worth it when you need to talk through why a method applies, not just how to run it.
What topics does a statistics class usually cover?
Most intro statistics courses move through five areas: describing one variable of data (mean, median, standard deviation), probability and random variables, sampling and distributions, inference (confidence intervals and hypothesis tests), and regression. This matches the five units College Board uses for AP Statistics.
Why is statistics so hard for so many students?
Statistics asks you to reason about uncertainty instead of getting one fixed answer, and most courses lean on vocabulary, like p-value or confidence interval, that sounds like everyday English but means something stricter. Research on statistics anxiety also points to course pacing and weak early study habits as big factors, not just the math itself.
Can AI do my statistics homework for me?
An AI tool can calculate a mean, run a hypothesis test, or check your work, but handing in that output as your own untouched work is still your call to make, and most teachers consider it the same as copying. Use it to see the steps and then redo the problem yourself so you can reproduce the method on a test.
What's the difference between a statistics tutor and an AI homework helper?
A human or online statistics tutor can notice when you're confused about a concept before you even ask the right question, and talk it through at your pace. An AI homework helper is available instantly, any hour, and is strongest when you already have a specific problem and want it solved step by step so you can learn the method.
How do I know whether to use the mean or the median?
Use the mean when the data doesn't have extreme outliers and is roughly symmetric. Use the median when a few very high or very low values would drag the mean away from where most of the data actually sits, income and home prices are classic examples. If you're not sure, a quick sketch of the data usually makes it obvious which one describes it better.
Is online statistics tutoring actually effective?
It can be, especially for working through specific problem types at your own pace instead of a whole class's pace. It works best paired with regular practice between sessions; a single session before a test tends to help far less than steady, smaller sessions across the unit.